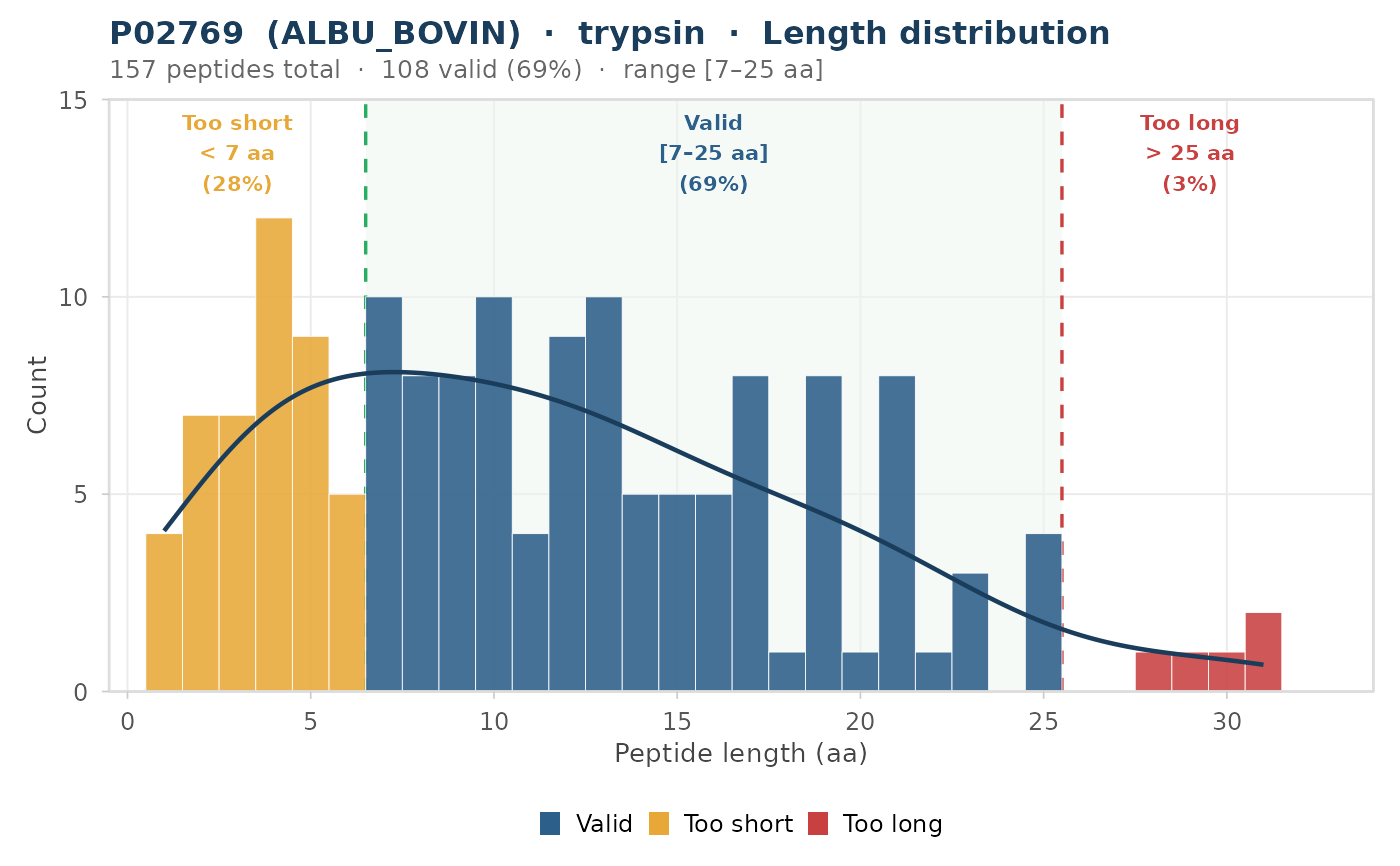
plot_length_distribution() draws a histogram of peptide lengths
colour-coded by validity class (Valid / Too short / Too long), with the
valid range shaded in the package's green, per-category percentage
annotations, and an optional density-curve overlay.
Usage
plot_length_distribution(
  result,
  length_range = c(7L, 25L),
  show_density = TRUE,
  title = NULL
)
Arguments
- result
A named list returned by
evaluate_digest(), or a data.frame / tibble with at least alengthcolumn (e.g. the$peptidesslot of such a result). IfNULLor an unrecognised type, raises an error.- length_range
Integer vector of length 2 giving the valid length window
c(lo, hi). Defaults toc(7L, 25L). Ignored (and read fromresult$params) when a fullevaluate_digest()result is supplied.- show_density
Logical. When
TRUE(default) a scaled kernel-density curve is overlaid on the histogram. IfNULL, treated asFALSE.- title
Optional character string for the plot title. Auto-generated when
NULL(default).
Value
A ggplot object showing a histogram of peptide lengths coloured
by validity class with valid-range shading and optional density overlay.
Details
When result is a named list of evaluate_digest() results
(multi-input mode), produces a faceted panel of length distributions
with one facet per result, using per-result valid-length ranges.
See also
evaluate_digest() for the upstream digestion step,
plot_digest_profile() for a single-protein digest summary.
Other plot-distribution:
plot_gravy_landscape(),
plot_missed_cleavage_impact(),
plot_mz_distribution(),
plot_pI_distribution()
Examples
if (requireNamespace("ggplot2", quietly = TRUE)) {
  bsa_path <- system.file("extdata", "P02769.fasta", package = "pepVet")
  res <- evaluate_digest(bsa_path, enzyme = "trypsin")
  p <- plot_length_distribution(res)
  print(p)
}