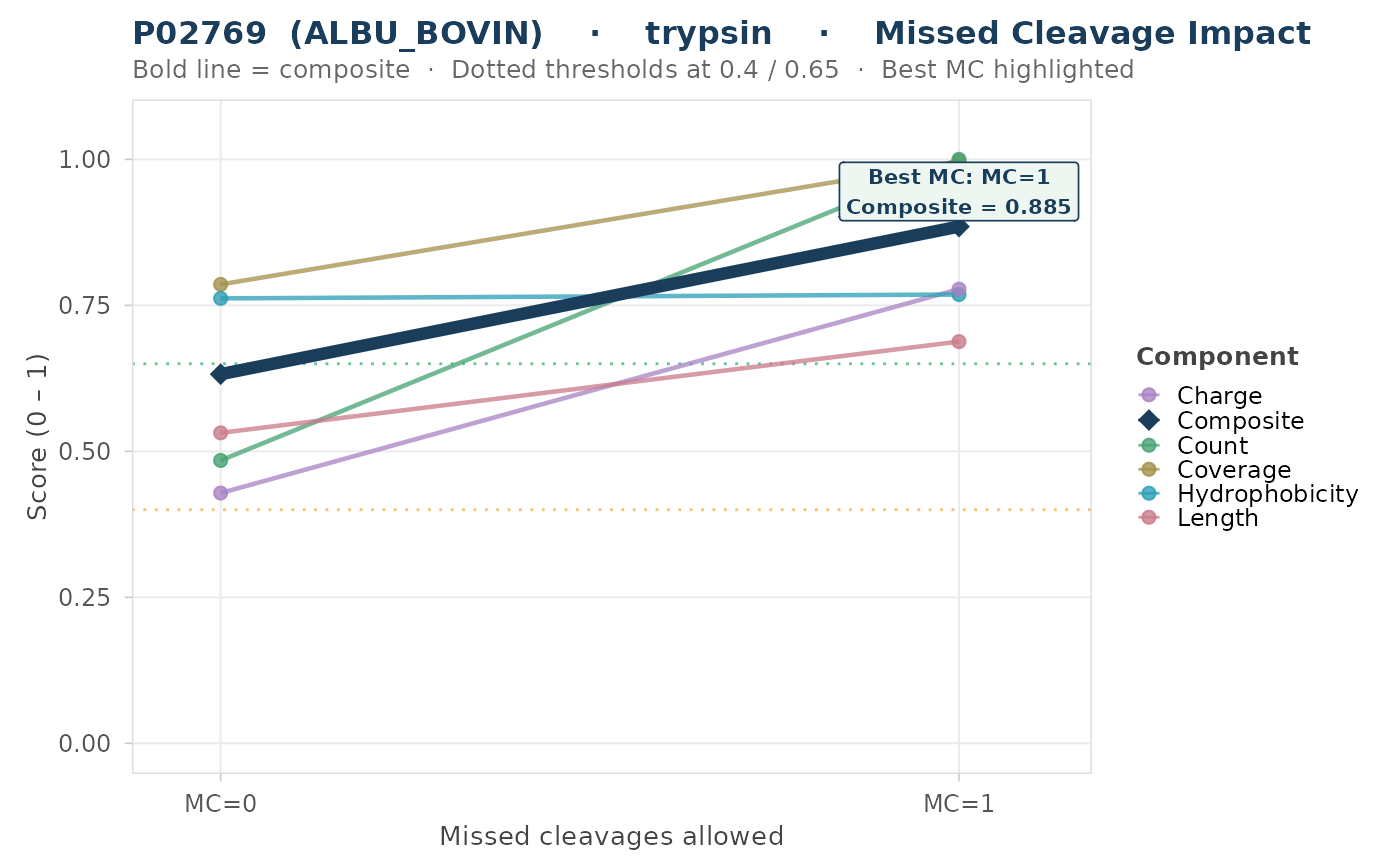
plot_missed_cleavage_impact() visualizes how allowing more missed
cleavages changes each component score and the composite. The user runs
evaluate_digest() at MC = 0, 1, 2 (or more) and passes the results as a
named list. Each component score is drawn as a connected line; the
composite score is drawn as a bold line. An annotation marks the MC count
that maximizes the composite.
Usage
plot_missed_cleavage_impact(
  results,
  components = c("S_length", "S_coverage", "S_count", "S_hydro", "S_charge"),
  title = NULL
)
Arguments
- results
A named list of
evaluate_digest()results. Names should be the MC level (e.g.,list("MC=0" = r0, "MC=1" = r1, "MC=2" = r2)). Or an unnamed list of length 2-4, in which case names are auto-assigned as"MC=0","MC=1", etc. All results must use the same protein and enzyme; only the missed-cleavage setting may differ. IfNULL, raises an error.- components
Character vector of component score columns to show. Defaults to
c("S_length","S_coverage","S_count","S_hydro","S_charge"). IfNULL, raises an error.- title
Optional character title. Auto-generated when
NULL.
Value
A ggplot object showing connected line plots of component and
composite scores across missed-cleavage levels, with an annotation at the
MC count that maximizes the composite.
See also
evaluate_digest() for the upstream digestion step.
Other plot-distribution:
plot_gravy_landscape(),
plot_length_distribution(),
plot_mz_distribution(),
plot_pI_distribution()
Examples
if (requireNamespace("ggplot2", quietly = TRUE)) {
  bsa_path <- system.file("extdata", "P02769.fasta", package = "pepVet")
  mc0 <- evaluate_digest(bsa_path, enzyme = "trypsin", missed_cleavages = 0)
  mc1 <- evaluate_digest(bsa_path, enzyme = "trypsin", missed_cleavages = 1)
  p <- plot_missed_cleavage_impact(list("MC=0" = mc0, "MC=1" = mc1))
  print(p)
}