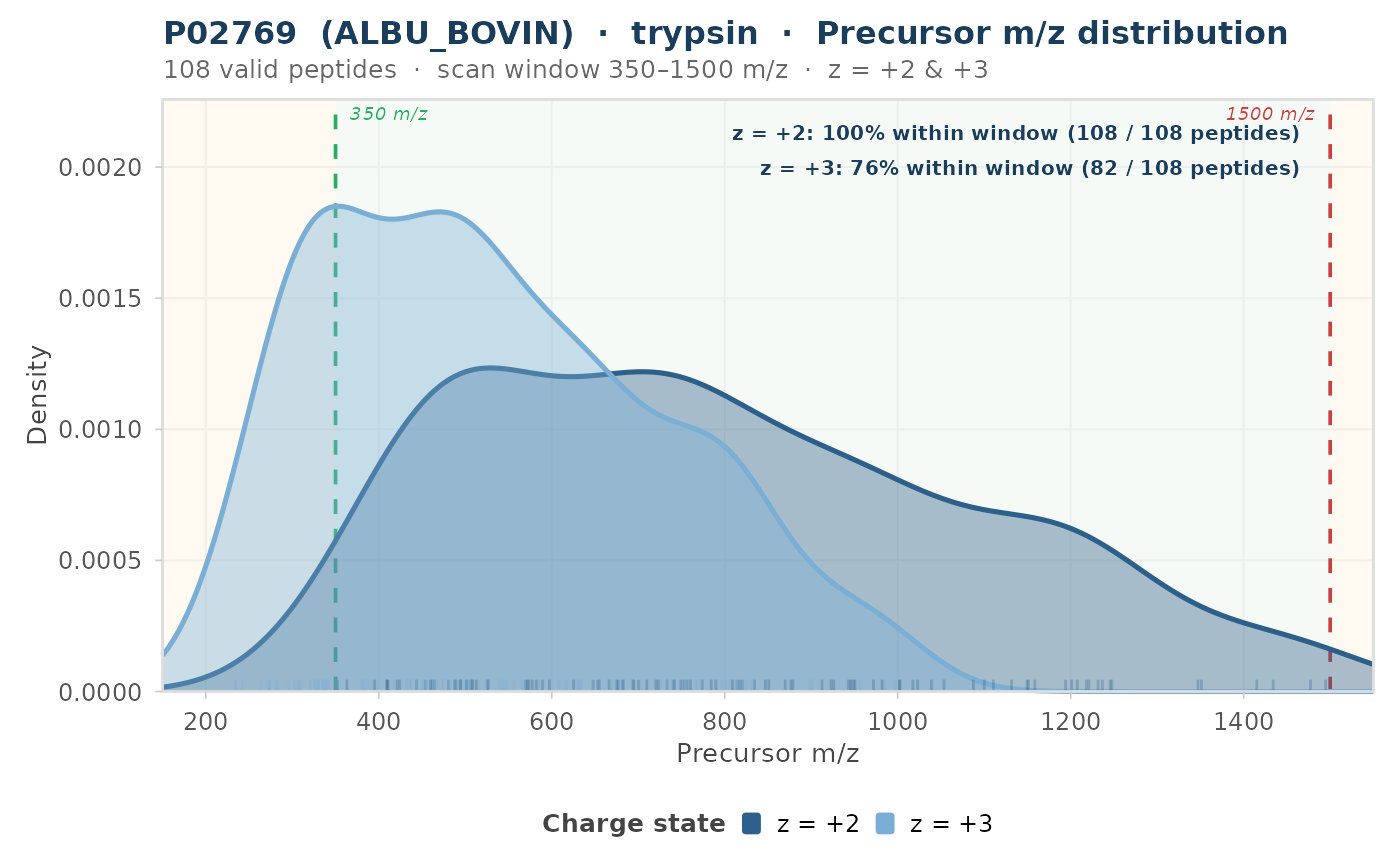
plot_mz_distribution() draws overlapping density fills for precursor
m/z values at charge states \(z = +2\) and \(z = +3\), overlaid on a
shaded instrument scan window. It adds a scan-window view alongside the
package's length, GRAVY, and pI summaries.
Arguments
- result
Accepted inputs:
A named list returned by
evaluate_digest(). Valid peptides are extracted automatically usinglength_range, and m/z values are computed viacalculate_peptide_mass().A named list of
evaluate_digest()results (multi-input mode). Produces a faceted plot with one panel per result.A data.frame / tibble with a
peptidecolumn. m/z values are computed from sequences.A data.frame / tibble with
mzandcharge_statecolumns (pre- computed m/z values;charge_statesargument is ignored). IfNULLor an unrecognised type, raises an error.
- scan_range
Numeric vector of length 2 giving the instrument's MS1 scan window boundaries in m/z. Defaults to
c(350, 1500)(typical DDA on Orbitrap / Q-TOF instruments). Usec(400, 1000)for targeted methods. IfNULLor malformed, raises an error.- charge_states
Integer vector of charge states to compute. Defaults to
2:3. Ignored whenresultalready contains anmzcolumn.- length_range
Integer vector of length 2. Valid peptide length window used to filter input peptides. Defaults to
c(7L, 25L). Read fromresult$paramswhen a fullevaluate_digest()result is supplied.- show_rug
Logical. When
TRUE(default) a rug of individual peptide m/z values is added below the density fills atalpha = 0.30. IfNULL, treated asFALSE.- title
Optional character string for the plot title. Auto-generated when
NULL(default).
Value
A ggplot object showing overlapping density fills of precursor
m/z values at each charge state, with shaded instrument scan window and
per-charge-state window-coverage annotations.
Details
Peptides inside the active length window can still fall outside a selected MS1 scan window at the displayed charge states. The plot shows those values against the user-supplied window.
The function accepts four input types with the following
precedence: (1) named list of evaluate_digest() results (multi-input
mode, produces a faceted panel per result), (2) single
evaluate_digest() result, (3) data.frame with a peptide column
(m/z computed from sequences), (4) data.frame with pre-computed mz
and charge_state columns.
See also
evaluate_digest() for the upstream digestion step,
calculate_peptide_mass() for the underlying m/z calculation.
Other plot-distribution:
plot_gravy_landscape(),
plot_length_distribution(),
plot_missed_cleavage_impact(),
plot_pI_distribution()
Examples
if (requireNamespace("ggplot2", quietly = TRUE)) {
  bsa_path <- system.file("extdata", "P02769.fasta", package = "pepVet")
  res <- evaluate_digest(bsa_path, enzyme = "trypsin")
  p <- plot_mz_distribution(res)
  print(p)
}