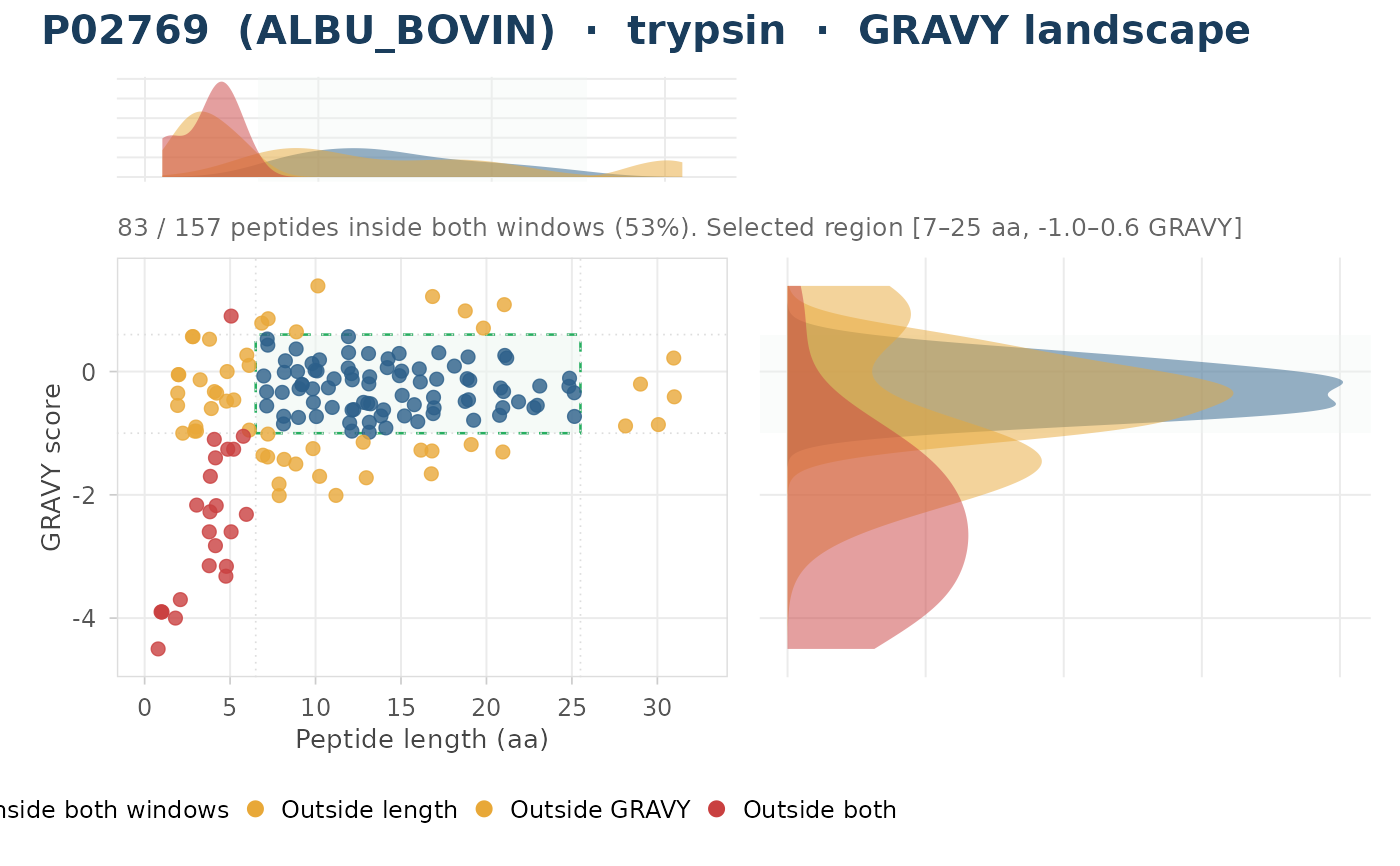
GRAVY Landscape: 2D Scatter of Peptide Length vs. Hydrophobicity
Source:R/plot_distribution.R
plot_gravy_landscape.Rdplot_gravy_landscape() plots each peptide as a point in the
length \(\times\) GRAVY physicochemical space. The selected
length-and-GRAVY region is shaded, points are colour-coded by window class,
and marginal density panels show the 1D distributions on each axis.
Peptides outside the selected region are labelled with their sequences when
their count is below label_outliers_n.
Arguments
- result
A named list returned by
evaluate_digest(), or a data.frame / tibble with at leastlengthandgravycolumns. When a bare data.frame lacks agravycolumn but has apeptidecolumn, GRAVY scores are computed automatically. IfNULLor an unrecognised type, raises an error.- length_range
Integer vector of length 2. Valid length window. Defaults to
c(7L, 25L). Read fromresult$paramswhen a fullevaluate_digest()result is supplied.- gravy_range
Numeric vector of length 2. LC-friendly GRAVY window. Defaults to
c(-1.0, 0.6). Read fromresult$paramswhen available.- label_outliers_n
Integer. Maximum number of outlier points to label with their peptide sequences. Labels are suppressed when the count exceeds this threshold. Defaults to
15L. IfNULL, raises an error.- title
Optional character string for the plot title. Auto-generated when
NULL(default).
Value
A patchwork object with a central scatter of length vs GRAVY
coloured by window class, and marginal density panels on the top and
right axes.
Details
When result is a named list of evaluate_digest() results
(multi-input mode), produces a faceted scatter with one panel per result
(no marginal densities). GRAVY scores are computed automatically when a
bare data.frame has a peptide column but no gravy column.
See also
evaluate_digest() for the upstream digestion step,
plot_digest_profile() for a single-protein digest summary.
Other plot-distribution:
plot_length_distribution(),
plot_missed_cleavage_impact(),
plot_mz_distribution(),
plot_pI_distribution()
Examples
if (requireNamespace("ggplot2", quietly = TRUE) &&
    requireNamespace("patchwork", quietly = TRUE)) {
  bsa_path <- system.file("extdata", "P02769.fasta", package = "pepVet")
  res <- evaluate_digest(bsa_path, enzyme = "trypsin")
  p <- plot_gravy_landscape(res)
  print(p)
}