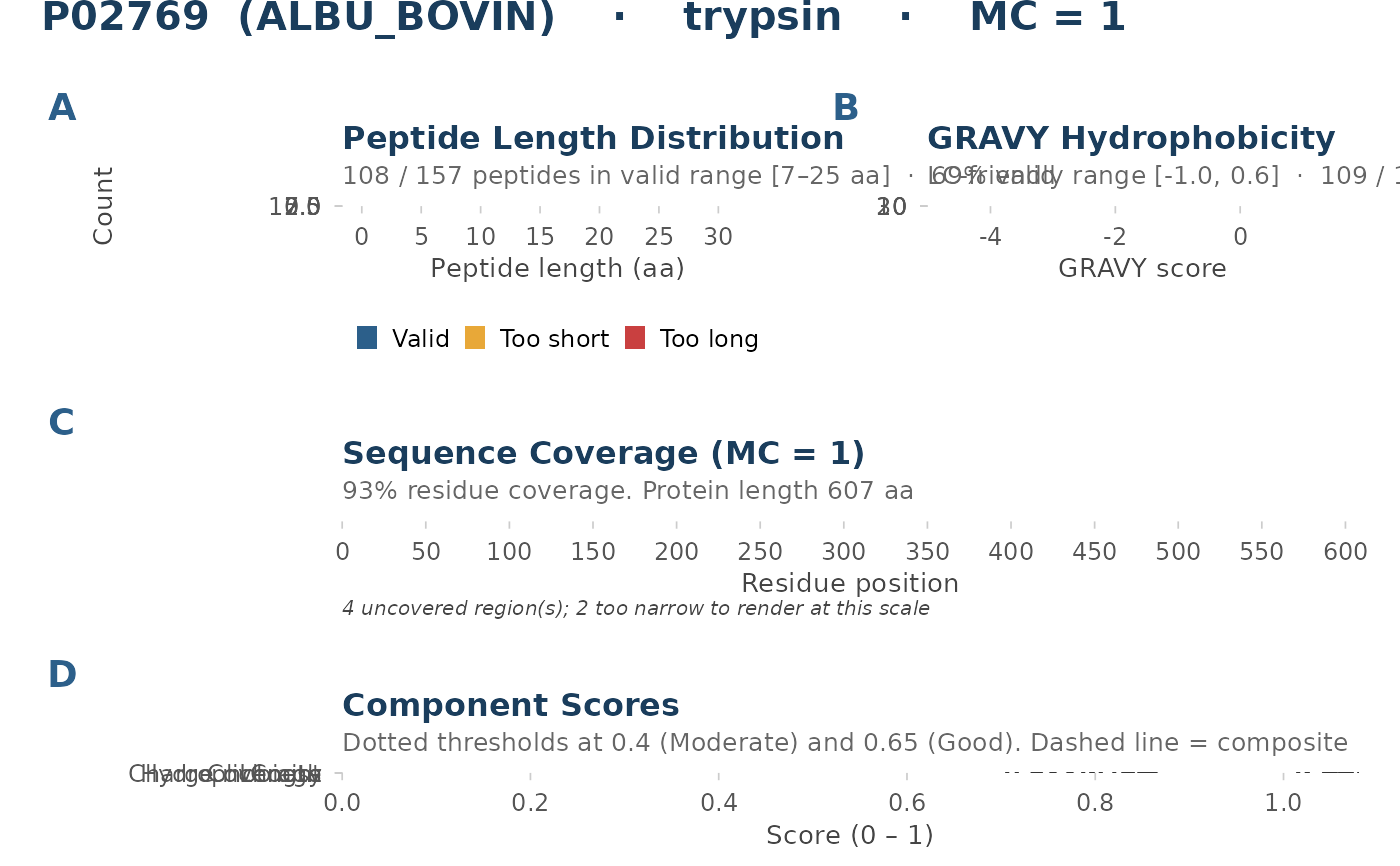
plot_digest_profile() assembles a four-panel figure for a single
protein-enzyme pair from an evaluate_digest() result. The panels are:
Arguments
- result
A named list returned by
evaluate_digest(). Must describe a single protein (one uniqueprotein_idinresult$peptides). IfNULLor invalid, raises an error.- length_range
Integer vector of length 2. Defines the valid peptide length window, passed to the length and coverage panels. Defaults to
c(7L, 25L).- gravy_range
Numeric vector of length 2. Defines the LC-friendly GRAVY range shaded in panel B. Defaults to
c(-1.0, 0.6).- title
Optional character string for the figure title. When
NULL(default) a title is auto-generated from the protein accession, enzyme, and missed-cleavage count.
Value
A patchwork object with four panels: length distribution (A),
GRAVY distribution (B), coverage map (C), and component scores (D).
Details
(A) Length distribution: histogram of peptide lengths with the valid window shaded. Bars are colored by length class: valid (blue), too short (amber), too long (rose).
(B) GRAVY distribution: histogram of GRAVY hydrophobicity scores. The LC-friendly range is shaded and bounded by dashed lines.
(C) Coverage map: protein drawn as horizontal lanes (one per missed-cleavage level) with valid-length peptides stacked via a greedy interval-packing algorithm. Uncovered regions are highlighted in red. Peptide length labels appear inside segments of 8 aa or longer.
(D) Component scores: horizontal bar chart for each scoring component, colored by tier (green \(\geq\) 0.65, amber 0.40-0.64, red < 0.40). The composite score is marked with a dashed vertical line.
GRAVY scores are computed internally from the peptide sequences in
result$peptides using the Kyte-Doolittle scale. No external columns are
required beyond the standard evaluate_digest() output.
Panel C labels peptide lengths inside segments of 8 aa or longer. For
heavily digested proteins this keeps the map readable without overlap.
When multiple missed-cleavage levels are present, each level occupies its
own horizontal lane with peptides stacked using the same greedy
interval-packing algorithm as plot_coverage_map().
See also
evaluate_digest() for the upstream digestion step,
plot_enzyme_comparison() for enzyme comparison across digests.
Other plot-single:
plot_cleavage_map(),
plot_coverage_map(),
plot_peptide_overlap_map(),
plot_weight_sensitivity()
Examples
if (requireNamespace("ggplot2", quietly = TRUE) &&
  requireNamespace("patchwork", quietly = TRUE)) {
  bsa_path <- system.file("extdata", "P02769.fasta", package = "pepVet")
  res <- evaluate_digest(bsa_path, enzyme = "trypsin", missed_cleavages = 1L)
  p <- plot_digest_profile(res)
  print(p)
}