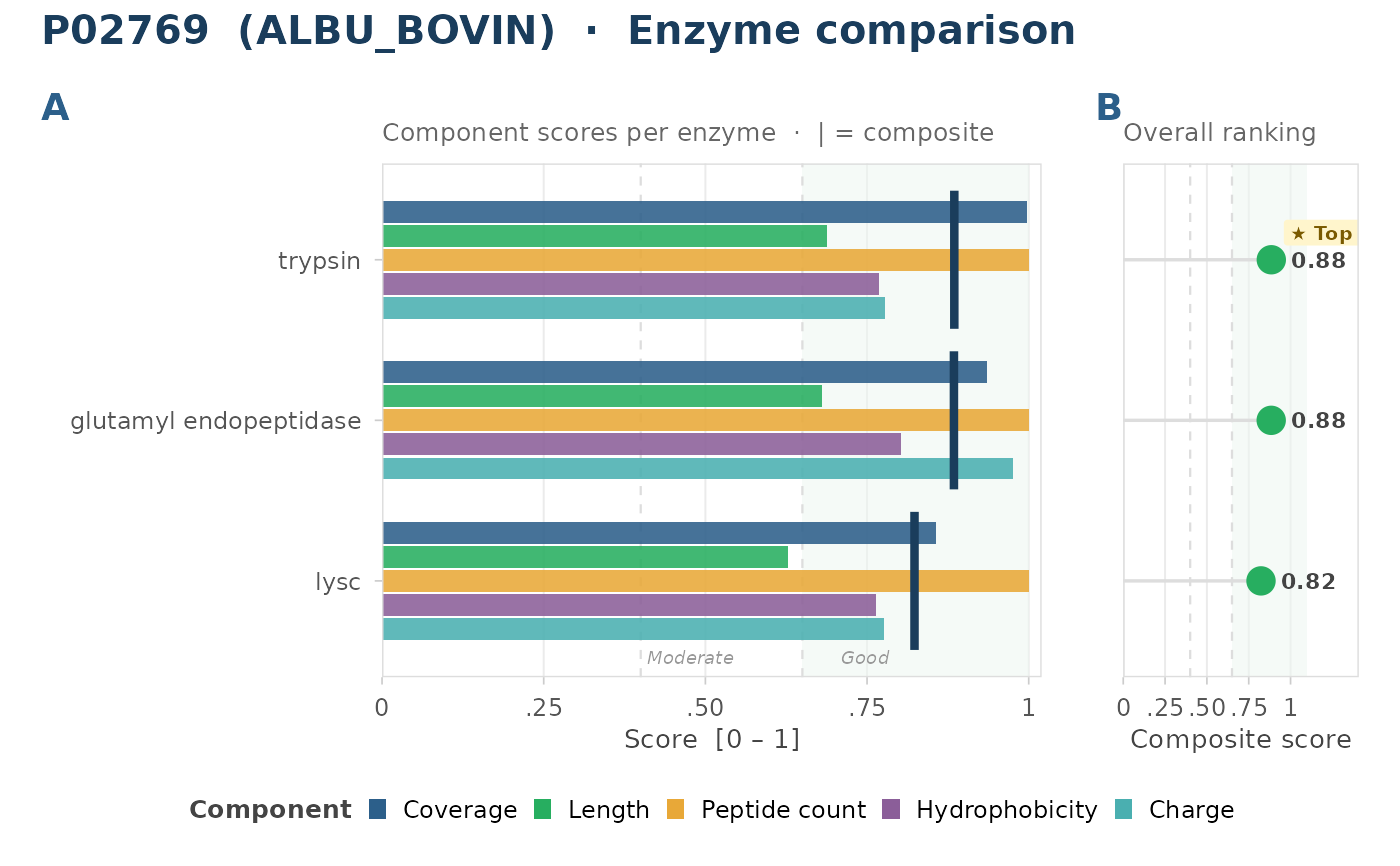
plot_enzyme_comparison() visualises the output of compare_digests() as
a dual-panel chart: component score bars (Panel A) and a composite score
lollipop with verdict badge (Panel B).
Usage
plot_enzyme_comparison(
  comparison,
  scores = c("S_coverage", "S_length", "S_count", "S_hydro", "S_charge"),
  recommend = TRUE,
  title = NULL
)
Arguments
- comparison
A tibble returned by
compare_digests(). Must contain at least the columnsenzymeandcomposite_score, plus whichever component-score columns are requested inscores. IfNULLor not a data frame, raises an error.- scores
Character vector of component-score column names to display in Panel A. Any column absent from
comparisonis silently dropped. Defaults to all five standard component scores.S_uniquecan be requested when present in a proteome-aware comparison. IfNULL, raises an error.- recommend
Logical. When
TRUE(default), a "Top model score" badge marks the enzyme with the highest composite score in Panel B. The badge is a model ranking, not an experimental recommendation. IfNULL, raises an error.- title
Optional character string for the overall plot title. Auto-generated from the protein accession when
NULL(default).
Value
A patchwork object with two panels: component-score grouped bar
chart (A) and composite-score lollipop with verdict badge (B).
Details
Panel A shows a horizontal grouped bar chart where each enzyme occupies one row and each component score is a separate colored bar, dodged side-by-side. Reference lines at the Moderate and Good verdict thresholds divide the axis into poor / moderate / good regions. Enzymes are sorted by composite score with the highest at the top.
Panel B shows the composite score as a lollipop, color-coded by verdict tier
(green >= 0.65, amber 0.40-0.64, red < 0.40). When recommend = TRUE a
gold "Top model score" badge is appended next to the top-ranked enzyme.
Examples
if (requireNamespace("ggplot2", quietly = TRUE) &&
  requireNamespace("patchwork", quietly = TRUE)) {
  bsa_path <- system.file("extdata", "P02769.fasta", package = "pepVet")
  comp <- compare_digests(bsa_path,
    enzymes = c(
      "trypsin", "lysc",
      "glutamyl endopeptidase"
    )
  )
  p <- plot_enzyme_comparison(comp)
  print(p)
}