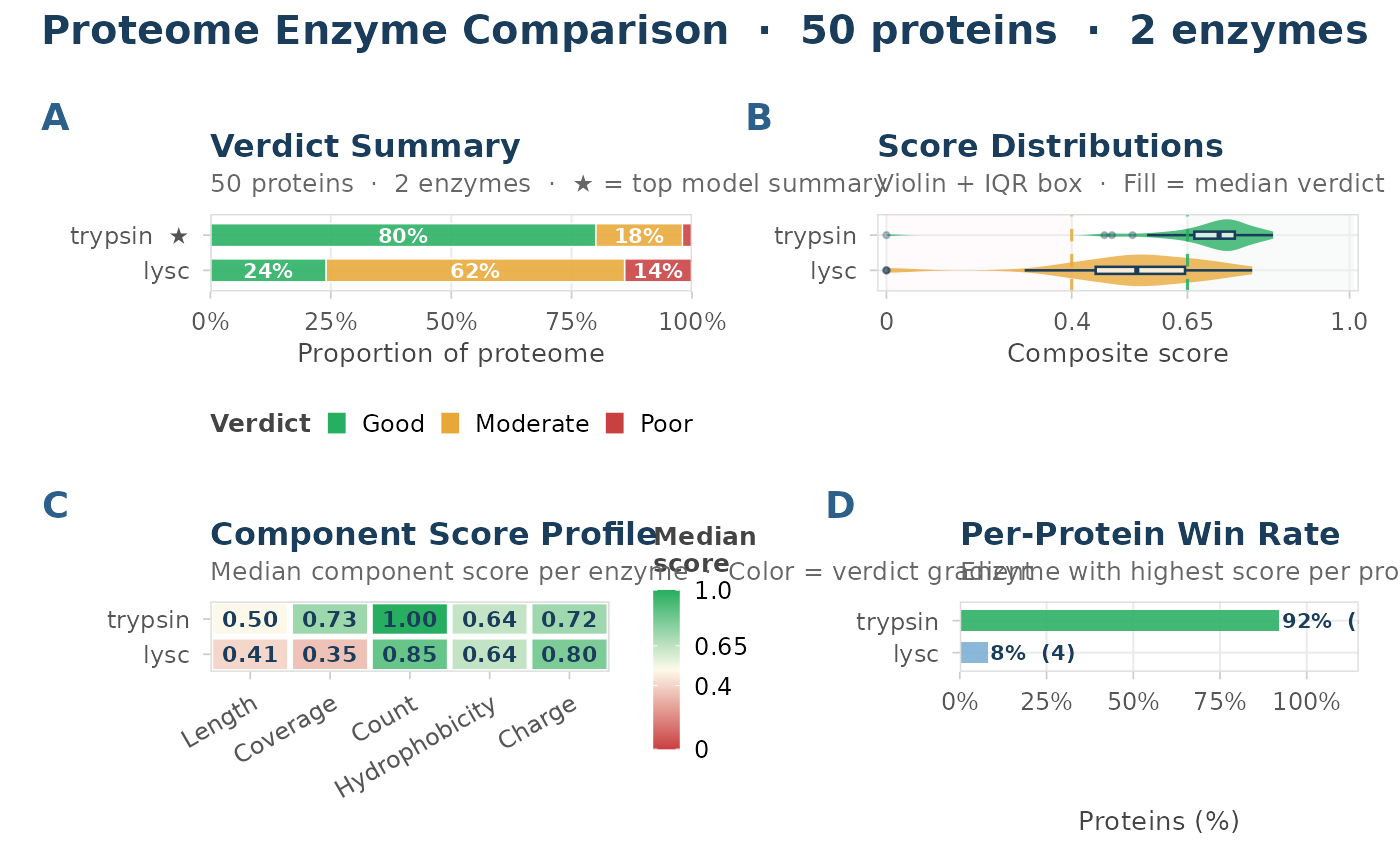
plot_batch_comparison() produces a four-panel side-by-side comparison of
enzyme performance across a full proteome, using output from
batch_compare_enzymes():
Arguments
- comparison
A
pepvet_batch_comparisontibble returned bybatch_compare_enzymes(), with columnsprotein_id,enzyme,composite_score,verdict, and the five component score columns. A proteome-aware comparison may also containS_unique, which is included in the component heatmap. IfNULLor empty, raises an error.- title
Optional character title for the combined figure. When
NULL(default), generates an auto-title with protein and enzyme counts.
Value
A patchwork object with four panels: verdict summary bars (A),
score distribution violins (B), component-score heatmap (C), and
per-protein win-rate bars (D).
Details
(A) Verdict summary: 100% stacked horizontal bars showing the Good/Moderate/Poor verdict breakdown per enzyme. Enzymes are ordered by descending Good%, and the highest model summary is marked with a star.
(B) Score distributions: horizontal violin plots for each enzyme, showing the full distribution of composite scores. An IQR boxplot is overlaid on each violin. Violin fill color reflects the enzyme's median verdict.
(C) Component heatmap: median component scores in an enzyme-by-component grid, filled by the verdict gradient (red to amber to green). Reveals which digest quality dimension differentiates the enzymes.
(D) Per-protein win rate: bar chart showing the proportion of proteins for which each enzyme achieves the highest composite score. The starred enzyme matches the top model summary in panel A.
Limitations
At proteome sizes exceeding 2000 proteins the figure panels become dense and text labels may overlap. Consider filtering the comparison to a representative subset or increasing the output dimensions.
See also
batch_compare_enzymes() for the upstream comparison step.
Other plot-batch:
plot_proteome_overview()
Examples
if (requireNamespace("ggplot2", quietly = TRUE) &&
  requireNamespace("patchwork", quietly = TRUE)) {
  small <- system.file(
    "extdata", "small_proteome_50_proteins.fasta",
    package = "pepVet"
  )
  comp <- batch_compare_enzymes(small, enzymes = c("trypsin", "lysc"))
  plot_batch_comparison(comp)
}
#> Scoring 50 proteins against 2 enzymes.
#> Warning: Protein "sp|P08246|ELNE_HUMAN Neutrophil elastase OS=Homo sapiens OX=9606
#> GN=ELANE PE=1 SV=1" has no cleavage sites for "lysc". S_count and composite
#> score set to 0; verdict set to Poor.