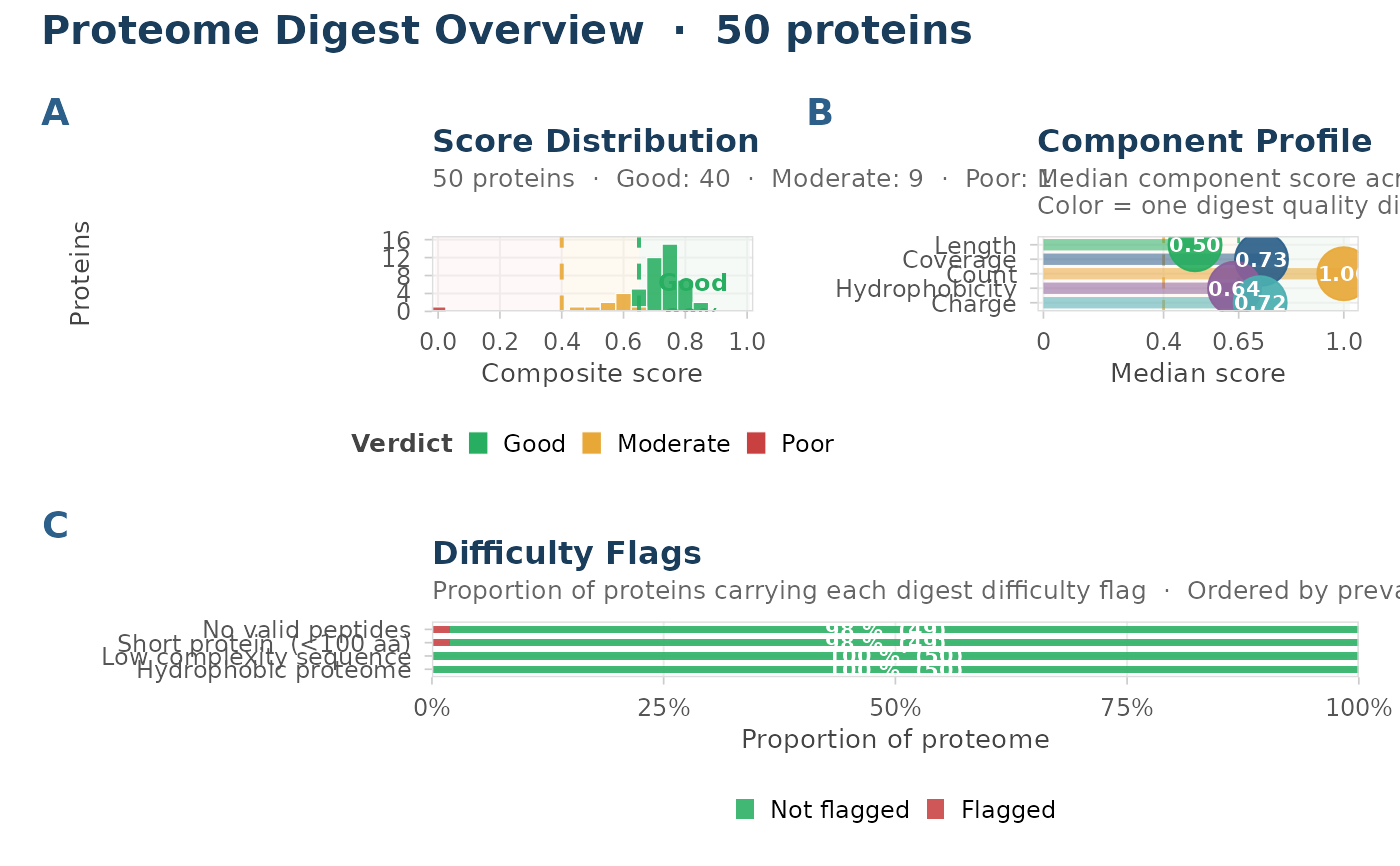
plot_proteome_overview() produces a three-panel portrait of a
single-enzyme proteome digest from batch_evaluate():
Arguments
- batch
A tibble returned by
batch_evaluate(), with columnsprotein_id,composite_score,verdict, the five component score columns, and the four difficulty flag columns. A proteome-aware batch may also containS_unique, which is included in the component profile. IfNULLor empty, raises an error.- title
Optional character title for the combined figure. When
NULL(default), generates an auto-title with protein count.
Value
A patchwork object with three panels: score distribution
histogram (A), component median lollipop chart (B), and difficulty-flag
prevalence bars (C).
Details
(A) Score distribution: histogram of composite scores, verdict-colored, with background zone shading for Good (>= 0.65), Moderate (0.40-0.65), and Poor (< 0.40) regions. A percentage badge is anchored in the Good zone.
(B) Component profile: horizontal lollipop chart showing the median of each component score across all proteins. Each component uses its designated color from the pepVet component palette. Immediately reveals which digest quality dimension is limiting the proteome.
(C) Difficulty flags: 100% stacked horizontal bars showing the proportion of proteins carrying each difficulty flag (short protein, no valid peptides, hydrophobic, low-complexity). Flags are ordered by prevalence (most common at top).
When the input batch lacks difficulty flag columns, panel C shows an empty placeholder message instead of stacked bars.
Limitations
At proteome sizes exceeding 2000 proteins the figure panels become dense and text labels may overlap. Consider filtering the batch to a representative subset or increasing the output dimensions.
See also
batch_evaluate() for the upstream evaluation step.
Other plot-batch:
plot_batch_comparison()
Examples
if (requireNamespace("ggplot2", quietly = TRUE) &&
  requireNamespace("patchwork", quietly = TRUE)) {
  small <- system.file(
    "extdata", "small_proteome_50_proteins.fasta",
    package = "pepVet"
  )
  batch <- batch_evaluate(small, enzyme = "trypsin")
  plot_proteome_overview(batch)
}