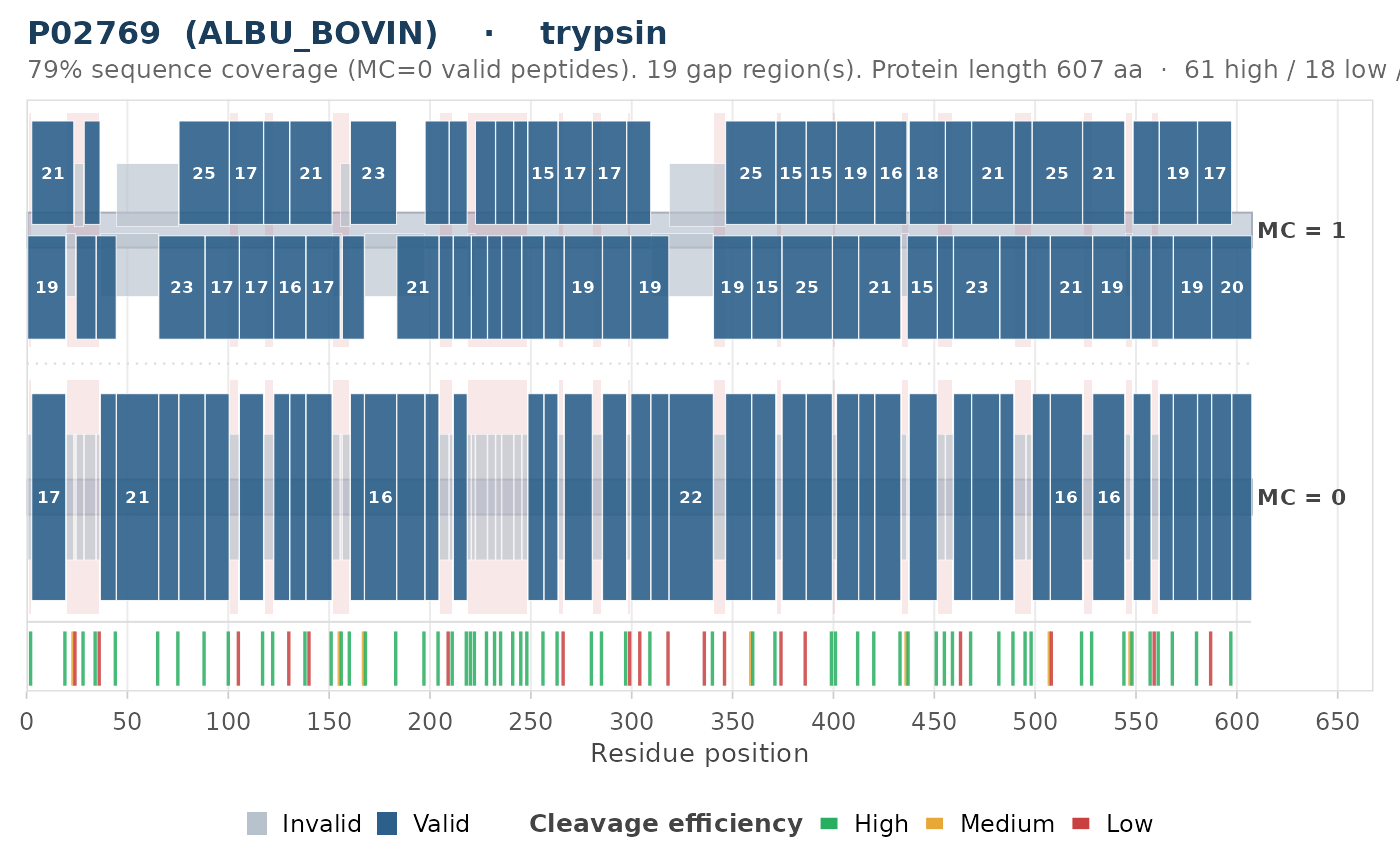
plot_coverage_map() draws a genome-browser-style view of how proteolytic
peptides map onto the full protein sequence. When the input contains
multiple missed-cleavage levels (e.g. MC = 0, 1, 2), each level occupies a
separate horizontal lane so the cumulative coverage gain from allowing missed
cleavages is immediately visible. Cleavage-site efficiency ticks and
optional domain annotations can be overlaid to add mechanistic context.
Arguments
- result
A named list returned by
evaluate_digest(). Must describe a single protein. IfNULLor invalid, raises an error.- color_by
Character string selecting the peptide color scheme.
"validity"(default)Blue = valid-length peptide; gray = invalid-length peptide.
"length_class"Three-way coloring: valid (blue), too short (amber), too long (rose-red).
"hydrophobicity"Continuous GRAVY gradient for every peptide: brand blue at the low end, green and amber through the middle, and rose-red at the high end of the displayed GRAVY range.
- length_range
Integer vector of length 2. Valid peptide window. Defaults to
c(7L, 25L).- cleavage_sites
Optional data.frame from
annotate_cleavage_sites(). When provided, vertical ticks below the lanes mark each cleavage site, colored by efficiency: high = green, medium = amber, low = rose-red.- domains
Optional data.frame with columns
name,start,end(integer, in residue positions). Each domain is drawn as a translucent background rectangle spanning all lanes with its name labelled at the top.- title
Optional character string for the plot title. Auto-generated from the protein accession and enzyme when
NULL(default).
Value
A ggplot object showing a multi-lane coverage map with peptide
tracks, gap highlights, optional cleavage-site efficiency ticks, and
optional domain annotations.
Details
Valid peptides are drawn taller than invalid peptides within each
lane, maintaining a visual hierarchy that keeps validity legible regardless
of color_by. When missed-cleavage levels overlap (MC >= 1), peptides
within each lane are distributed into non-overlapping tracks using a greedy
interval-packing algorithm, mirroring genome-browser stacking. Gap regions
(residues not covered by any valid MC = 0 peptide) are highlighted with a
translucent red overlay. Peptide lengths are labelled inside bars whose
span is at least 2.5 % of the protein length (ensuring legibility at
typical export widths); shorter bars are left unlabelled.
The color_by = "hydrophobicity" mode calls the internal Kyte-Doolittle
GRAVY calculator and requires no additional input columns.
Limitations
The interval-packing algorithm requires consistent, non-overlapping MC=0 peptide boundaries. Incomplete or conflicting peptide coordinates may produce suboptimal track layouts or raise an error during sequence reconstruction.
See also
evaluate_digest() for the upstream digestion step,
annotate_cleavage_sites() for cleavage-site annotation.
Other plot-single:
plot_cleavage_map(),
plot_digest_profile(),
plot_peptide_overlap_map(),
plot_weight_sensitivity()
Examples
if (requireNamespace("ggplot2", quietly = TRUE)) {
  bsa_path <- system.file("extdata", "P02769.fasta", package = "pepVet")
  res <- evaluate_digest(bsa_path, enzyme = "trypsin", missed_cleavages = 1)
  cs <- annotate_cleavage_sites(bsa_path, enzyme = "trypsin")
  p <- plot_coverage_map(res, cleavage_sites = cs)
  print(p)
}