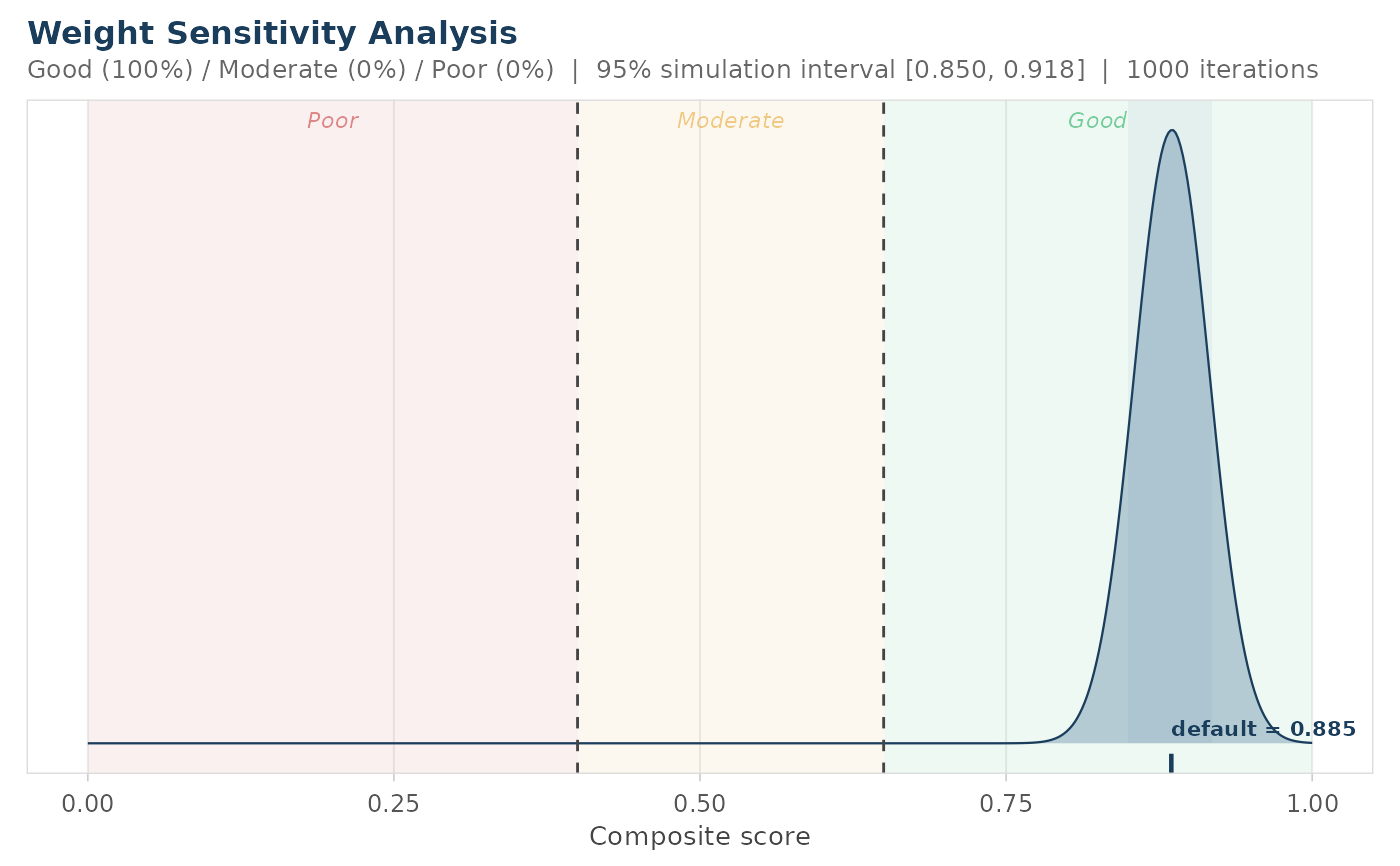
plot_weight_sensitivity() visualises the result of
sensitivity_analysis(). For single-protein input it draws one composite
density over explicit verdict zones, with threshold lines, a simulation
interval, and a rug mark at the reference composite. For batch input it
draws a faceted histogram of per-row verdict instability with per-enzyme
mean and median annotations.
Arguments
- x
A single-protein or batch result returned by
sensitivity_analysis(). Multi-enzyme summary results do not contain the per-draw values required by this plot. IfNULLor unrecognised, raises an error.- title
Optional character string for the plot title. When
NULL(default) a title is auto-generated.
Value
A ggplot object: density plot of composite scores with verdict
shading (single-protein mode) or faceted histogram of verdict instability
(batch mode).
See also
sensitivity_analysis() for the upstream weight-sensitivity
simulation.
Other plot-single:
plot_cleavage_map(),
plot_coverage_map(),
plot_digest_profile(),
plot_peptide_overlap_map()
Examples
if (requireNamespace("ggplot2", quietly = TRUE) &&
    requireNamespace("withr", quietly = TRUE)) {
  bsa_path <- system.file("extdata", "P02769.fasta", package = "pepVet")
  res <- evaluate_digest(bsa_path, enzyme = "trypsin")
  sens <- withr::with_seed(
    42,
    sensitivity_analysis(res, n_iter = 1000L)
  )
  plot_weight_sensitivity(sens)
}