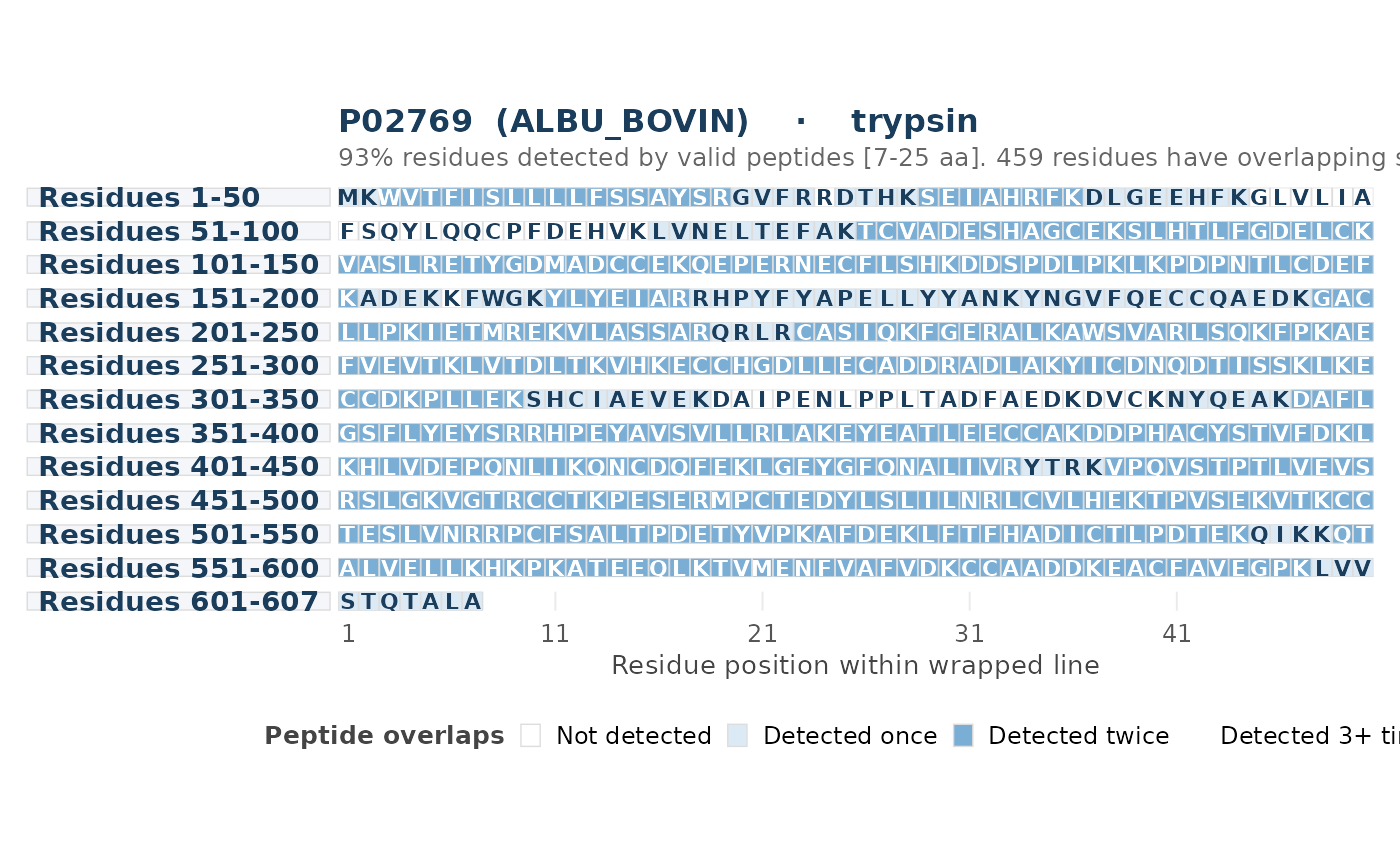
plot_peptide_overlap_map() renders a wrapped residue-level view of a
single protein and colors each amino-acid tile by how many peptides
cover that residue (MC=0 only by default). Uncovered residues are white;
increasing overlap depth gets progressively stronger blue fills.
The subtitle reports the maximum overlap, which helps gauge whether the
6-color scale (0, 1, 2-3, 4-7, 8-15, 16+) is sufficient for your data.
Usage
plot_peptide_overlap_map(
  result,
  length_range = c(7L, 25L),
  missed_cleavages = 1L,
  residues_per_line = 50L,
  title = NULL
)
Arguments
- result
A named list returned by
evaluate_digest(). Must describe a single protein. IfNULLor invalid, raises an error.- length_range
Optional integer vector of length 2 defining which peptide lengths count toward overlap. Defaults to
c(7L, 25L). Peptides are counted from the MC level specified bymissed_cleavages. Uselength_range = NULLto count all digested peptides at all missed-cleavage levels.- missed_cleavages
Integer. Which missed-cleavage level to use for the overlap count. Defaults to
1L(standard bottom-up practice). Pass0Lfor strict non-overlapping fragments, orNULLto count all MC levels (automatically set whenlength_range = NULL).- residues_per_line
Positive integer. Number of residues to show before wrapping to the next display row. Defaults to
50L. IfNULLor non-integer, raises an error.- title
Optional character string for the plot title. Auto-generated from the protein accession and enzyme when
NULL(default).
Value
A ggplot object showing one tile per residue colored by peptide
overlap depth (white for uncovered, escalating blue fills for 1, 2-3,
4-7, 8-15, or 16+ covering peptides).
Details
The plotted letters are reconstructed from the MC=0 peptide set in
result$peptides, so the plot can be generated directly from an
evaluate_digest() result without re-reading the original FASTA input.
Overlap counts are computed from valid-length MC=1 peptides by default
(configurable via missed_cleavages). Pass missed_cleavages = 0L for
strict non-overlapping fragments, or length_range = NULL to count all
digested peptides at all missed-cleavage levels.
See also
evaluate_digest() for the upstream digestion step.
Other plot-single:
plot_cleavage_map(),
plot_coverage_map(),
plot_digest_profile(),
plot_weight_sensitivity()
Examples
if (requireNamespace("ggplot2", quietly = TRUE)) {
  bsa_path <- system.file("extdata", "P02769.fasta", package = "pepVet")
  res <- evaluate_digest(bsa_path, enzyme = "trypsin", missed_cleavages = 1)
  p <- plot_peptide_overlap_map(res)
  print(p)
}