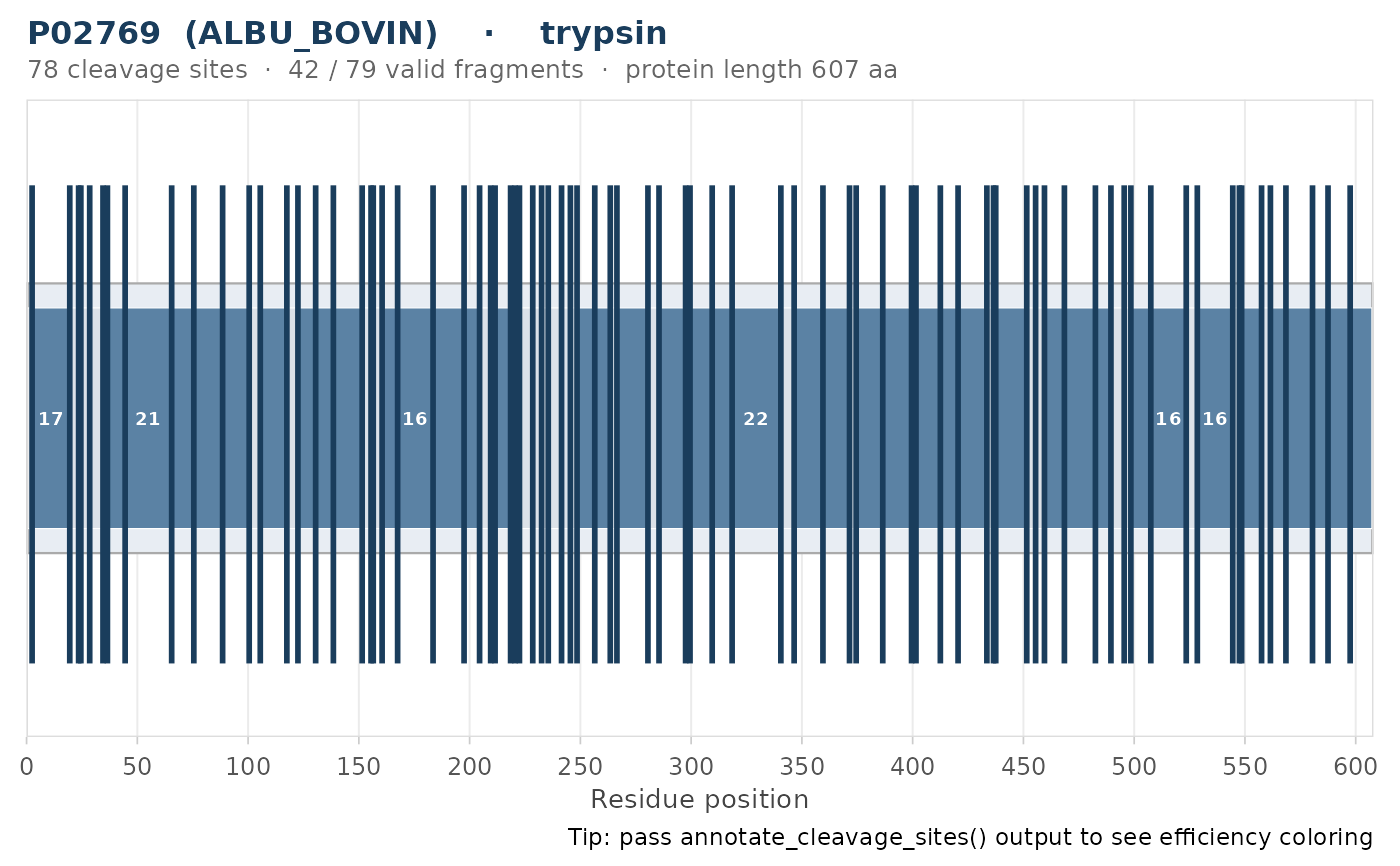
plot_cleavage_map() draws the full protein as a horizontal bar and marks
every cleavage site as a vertical tick, colored by efficiency (high=green,
medium=amber, low=red). Peptide fragments between consecutive cleavage
sites are drawn as colored blocks, with invalid peptides dimmed. When
cleavage_sites data is not available, sites are inferred from the peptide
boundaries and all rendered as the same default color.
Usage
plot_cleavage_map(
  result,
  cleavage_sites = NULL,
  length_range = c(7L, 25L),
  title = NULL
)
Arguments
- result
A named list returned by
evaluate_digest(). IfNULLor invalid, raises an error.- cleavage_sites
Optional data.frame from
annotate_cleavage_sites()with columnsposition,efficiency(character:"high","medium","low"), and optionallyrule. WhenNULL(default) sites are inferred from peptide boundaries.- length_range
Integer vector of length 2. Valid peptide window. Defaults to
c(7L, 25L).- title
Optional character title. Auto-generated when
NULL.
Value
A ggplot object showing a protein bar with cleavage-site ticks
colored by efficiency and peptide fragment blocks between sites.
Details
When cleavage_sites is not supplied, cleavage positions are
inferred from the C-terminal ends of MC=0 peptides (excluding the true
C-terminus of the protein). Inferred sites all render in the same default
color. Pass the output of annotate_cleavage_sites() for efficiency-aware
coloring.
See also
evaluate_digest() for the upstream digestion step,
annotate_cleavage_sites() for efficiency-annotated cleavage sites.
Other plot-single:
plot_coverage_map(),
plot_digest_profile(),
plot_peptide_overlap_map(),
plot_weight_sensitivity()
Examples
if (requireNamespace("ggplot2", quietly = TRUE)) {
  bsa_path <- system.file("extdata", "P02769.fasta", package = "pepVet")
  res <- evaluate_digest(bsa_path, enzyme = "trypsin")
  p <- plot_cleavage_map(res)
  print(p)
}