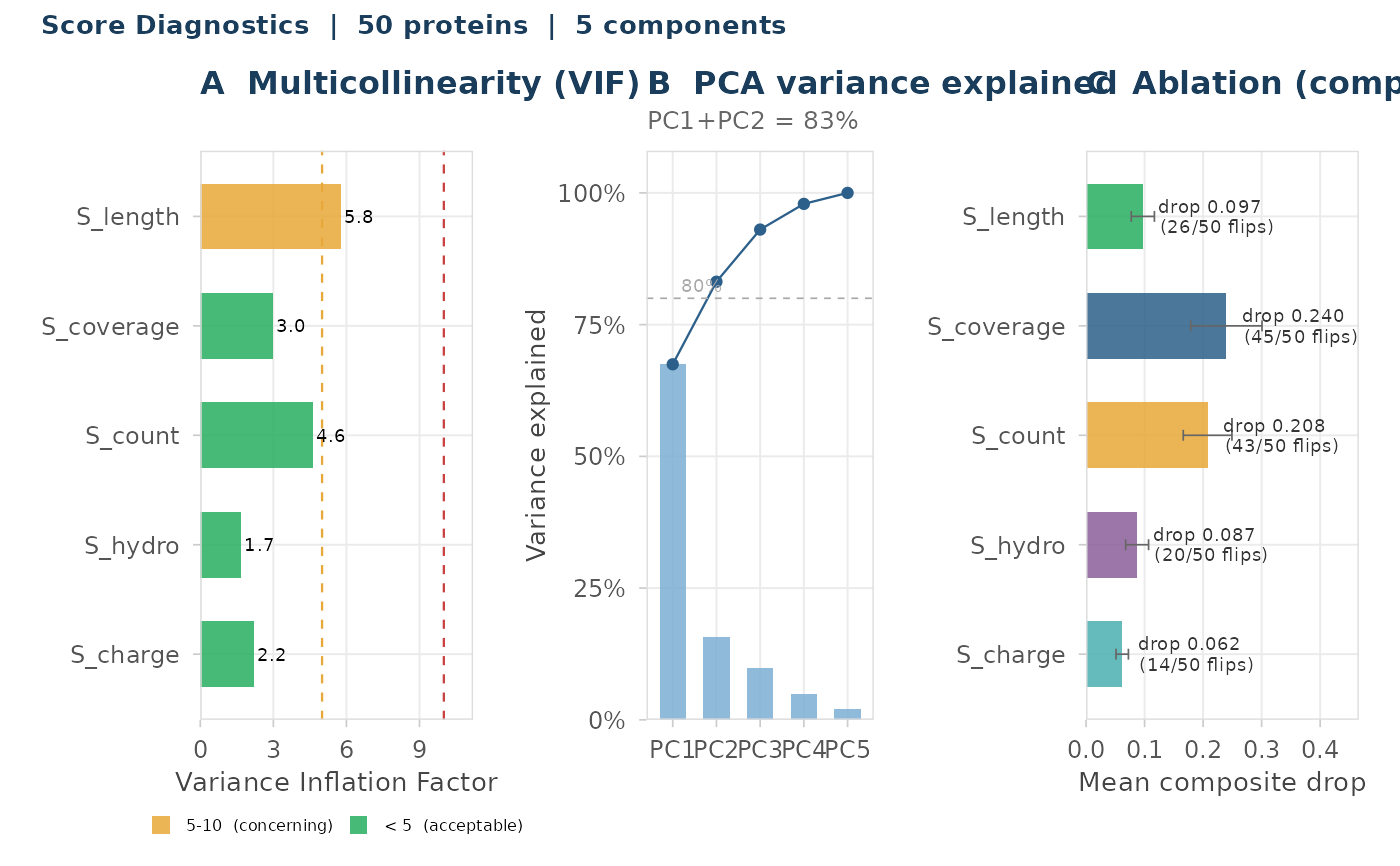
plot_score_diagnostics() visualises the result of
score_diagnostics() as a three-panel figure: (A) VIF bar chart
with threshold lines at 5 and 10, (B) PCA scree plot with cumulative
variance line and an 80% reference, (C) ablation waterfall showing
the mean composite drop with error bars when each component is set
to zero, annotated with the number of verdicts that flip.
Arguments
- x
A list returned by
score_diagnostics(). IfNULLor missing required elements, raises an error.- title
Optional character string for an overall figure title. When
NULL(default), generates "Score Diagnostics" with the protein and component counts.
See also
score_diagnostics() for the upstream analysis.
Other diagnostics:
score_diagnostics()
Examples
if (requireNamespace("ggplot2", quietly = TRUE) &&
    requireNamespace("patchwork", quietly = TRUE)) {
  small_fasta <- system.file(
    "extdata", "small_proteome_50_proteins.fasta",
    package = "pepVet"
  )
  batch <- batch_evaluate(small_fasta, enzyme = "trypsin")
  diag <- score_diagnostics(batch)
  p <- plot_score_diagnostics(diag)
  print(p)
}